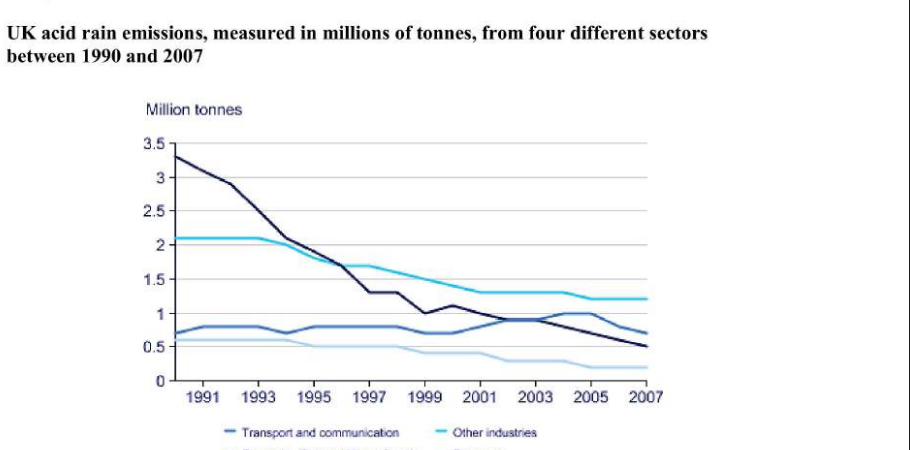
The line graph compares four sectors in terms of the amount of acid rain emissions
that they produced over a period of 17 years in the UK.
It is clear that the total amount of acid rain emissions in the UK fell considerably
between 1990 and 2007. The most dramatic decrease was seen in the electricity, gas
and water supply sector.
In 1990, around 3.3 million tonnes of acid rain emissions came from the electricity,
gas and water sector. The transport and communication sector was responsible for
about 0.7 million tonnes of emissions, while the domestic sector produced around
0.6 million tonnes. Just over 2 million tonnes of acid rain gases came from other
industries.
Emissions from electricity, gas and water supply fell dramatically to only 0.5
million tonnes in 2007, a drop of almost 3 million tonnes. While acid rain gases
from the domestic sector and other industries fell gradually, the transport sector saw
a small increase in emissions, reaching a peak of 1 million tonnes in 2005.
Estimated IELTS Band Score: 6.5 – 7.0
Breakdown:
- Task Achievement: 7.0 – Covers trends well but lacks some deeper comparisons.
- Coherence & Cohesion: 6.5 – Logical structure, but transitions could be smoother.
- Lexical Resource: 6.5 – Some repetition and basic vocabulary.
- Grammar & Accuracy: 6.0 – Minor errors and awkward phrasing.
Band 7-8 :
The line graph presents data on acid rain emissions from four different sectors in the UK between 1990 and 2007, measured in millions of tonnes.
It is evident that total emissions fell significantly over this period, with the most substantial reduction occurring in the electricity, gas, and water supply sector.
In 1990, emissions from this sector were the highest at about 3.3 million tonnes. Other industries contributed just over 2 million tonnes, while the transport sector and domestic sources accounted for approximately 0.7 and 0.6 million tonnes, respectively.
By 2007, emissions from the electricity, gas, and water sector had declined dramatically to around 0.5 million tonnes, representing the largest drop. Meanwhile, domestic and industrial emissions gradually decreased, whereas transport emissions fluctuated slightly, peaking at 1 million tonnes in 2005 before declining again.
Band 9 :
The line graph illustrates the volume of acid rain emissions in the UK from 1990 to 2007 across four sectors: electricity, gas and water supply, transport and communication, other industries, and domestic sources.
Overall, acid rain emissions saw a significant decline over the 17-year period. The most notable reduction occurred in the electricity, gas, and water supply sector, while other industries and domestic emissions followed a similar downward trend. In contrast, transport emissions exhibited slight fluctuations.
In 1990, the electricity, gas, and water sector was the largest contributor, releasing around 3.3 million tonnes of acid rain gases. Other industries accounted for just over 2 million tonnes, while emissions from transport and domestic sources stood at 0.7 and 0.6 million tonnes, respectively.
By 2007, emissions from the electricity sector had plummeted to 0.5 million tonnes, a decrease of nearly 3 million tonnes. Industrial and domestic emissions also declined, while transport-related emissions briefly peaked at 1 million tonnes in 2005 before falling again.
Key Differences Between Band 7-8 and Band 9 Versions
| Aspect | Band 7-8 Version | Band 9 Version |
|---|---|---|
| Vocabulary | Uses basic descriptions like “fell significantly” | Uses more precise terms like “saw a significant decline” |
| Sentence Structure | Mostly simple and complex sentences | Uses advanced structures and a varied sentence mix |
| Data Presentation | Covers key numbers but lacks in-depth comparisons | More detailed descriptions and clear contrasts |
| Clarity & Cohesion | Some transitions but could be smoother | More seamless flow with natural transitions |
Grammar Mistakes & Corrections
- “The most dramatic decrease was seen in the electricity, gas and water supply sector.”
- Issue: Passive voice makes the sentence less direct.
- Improved: “The electricity, gas, and water supply sector experienced the most dramatic decline.”
- “Emissions from electricity, gas and water supply fell dramatically to only 0.5 million tonnes in 2007, a drop of almost 3 million tonnes.”
- Issue: “Only” is unnecessary and informal.
- Improved: “Emissions from the electricity, gas, and water supply sector fell sharply to 0.5 million tonnes in 2007, a decline of nearly 3 million tonnes.”
- “The transport sector saw a small increase in emissions, reaching a peak of 1 million tonnes in 2005.”
- Issue: Slightly informal phrasing.
- Improved: “The transport sector experienced a modest rise in emissions, peaking at 1 million tonnes in 2005.”
Vocabulary Repetition & Suggestions
- Repeated words: “fell,” “decreased,” “sector,” “million tonnes”
- Alternative suggestions:
- Fell → declined, dropped, plummeted
- Decreased → reduced, diminished, contracted
- Sector → industry, category, division
- Million tonnes → MT, million metric tons, millions of tons
IELTS Writing Task 1 Exercise
Fill in the blanks using the following words:
(by, at, in, around, of, over, with, about, peaked, gradually)
- The graph compares four sectors ___ terms ___ the amount of acid rain emissions they produced between 1990 and 2007.
- It is clear that the total amount of acid rain emissions ___ the UK fell considerably ___ this period.
- The electricity, gas, and water supply sector was responsible for the highest emissions ___ approximately 3.3 million tonnes in 1990.
- The transport and communication sector contributed ___ 0.7 million tonnes, while domestic sources accounted for ___ 0.6 million tonnes.
- Emissions from the electricity sector declined significantly, ___ dropping to 0.5 million tonnes ___ 2007.
- The transport sector ___ at 1 million tonnes in 2005 before declining again.
- While emissions from other industries and domestic sources fell steadily, the transport sector saw slight fluctuations ___ minor increases before eventually declining.
Answers (Separate Step for Better Engagement)
- The graph compares four sectors in terms of the amount of acid rain emissions they produced between 1990 and 2007.
- It is clear that the total amount of acid rain emissions in the UK fell considerably over this period.
- The electricity, gas, and water supply sector was responsible for the highest emissions at approximately 3.3 million tonnes in 1990.
- The transport and communication sector contributed about 0.7 million tonnes, while domestic sources accounted for around 0.6 million tonnes.
- Emissions from the electricity sector declined significantly, gradually dropping to 0.5 million tonnes by 2007.
- The transport sector peaked at 1 million tonnes in 2005 before declining again.
- While emissions from other industries and domestic sources fell steadily, the transport sector saw slight fluctuations with minor increases before eventually declining.