Posted inIELTS Writing Task 1 Graph with Trends IELTS Writing Task 1: Internet Users in Three Countries (1999-2009) The line graph compares the percentage of people in three countries who used theInternet between 1999 and 2009.It… Posted by
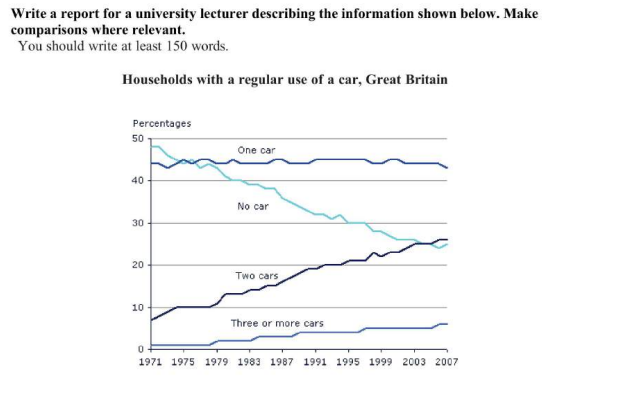
Posted inIELTS Writing Task 1 IELTS Writing Task 1: Car Ownership in Great Britain (1971-2007) The graph shows changes in the number of cars per household in Great Britain over aperiod of 36… Posted by
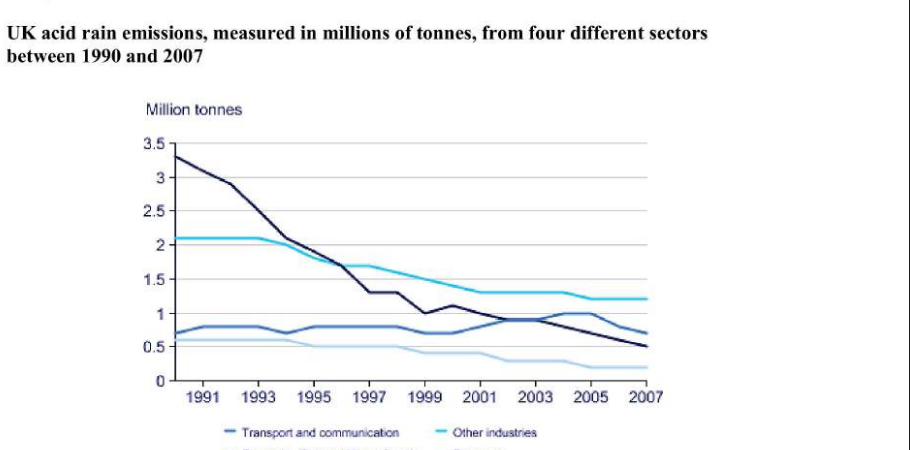
Posted inUncategorized Academic Writing Task 1 : The table below gives information on UK acid rain emissions, measured in millions of tonnes, from four different sectors between 1990 and 2007. The line graph compares four sectors in terms of the amount of acid rain emissionsthat they produced over… Posted by