Skip to content
listeningwritingmodule.com
  • Home
  • About Us
  • IELTS
  • PTE
  • TOEFL
  • Contact
  • Facebook
  • Instagram
  • Youtube
Subscribe

IELTS Writing Task 1

BRITISH EMIGRATION TO SELECTED DESTINATIONS - 2004-2007
Posted inIELTS Writing Task 1 Graph with Trends

IELTS Writing Task 1:The chart shows British Emigration to selected destinations between 2004 and 2007

The bar chart shows the number of British people who emigrated to five destinationsover the period 2004 to…
Posted by
Consumption of Fast Food by Australian Teenagers
Posted inIELTS Writing Task 1 Graph with Trends

IELTS Writing Task 1:The line graph below shows changes in the amount and type of fast food consumed by Australian teenagers from 1975 to 2000

The line graph illustrates the amount of fast food consumed by teenagers in Australiabetween 1975 and 2000, a…
Posted by
Number of commuters (millions)
Posted inIELTS Writing Task 1 Graph with Trends

IELTS Writing Task 1:The graph below shows the average number of UK commuters travelling each day by car, bus or train between 1970 and 2030

The line graph compares figures for daily travel by workers in the UK using threedifferent forms of transport…
Posted by
Average annual expenditures on cell phone and residential phone services, 2001-2010
Posted inIELTS Writing Task 1 Graph with Trends

IELTS Writing Task 1:The graph shows the average annual expenditure on cell phone and residential phone services

The line graph compares average yearly spending by Americans on mobile andlandline phone services from 2001 to 2010.It…
Posted by
Monthly Temperature and Precipitation
Posted inIELTS Writing Task 1 Graph with Trends

IELTS Writing Task 1:The climograph below shows average monthly temperatures and rainfall in the city of Kolkata

The chart compares average figures for temperature and precipitation over thecourse of a calendar year in Kolkata.It is…
Posted by
Proportion of population aged 65 and over
Posted inGraph with Trends IELTS Writing Task 1

IELTS Writing Task 1:The graph below shows the proportion of the population aged 65 and over between 1940 and2040 in three different countries

The line graph compares the percentage of people aged 65 or more in three countries over aperiod of…
Posted by
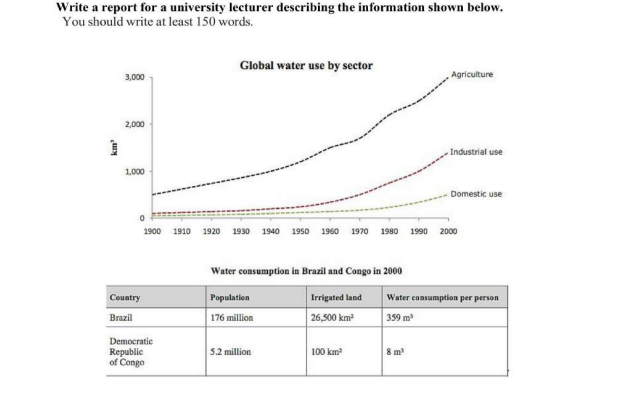
Global water use by sector
Posted inGraph with Trends IELTS Writing Task 1

IELTS Writing Task 1:The graph and table below give information about water use worldwide and water consumption in two different countries.

The charts compare the amount of water used for agriculture, industry and homesaround the world, and water use…
Posted by
International Migration, UK, 1999-2008
Posted inGraph with Trends IELTS Writing Task 1

Writing Task 1 – International Migration to the UK (1999-2008)

The chart gives information about UK immigration, emigration and net migrationbetween 1999 and 2008.Both immigration and emigration rates…
Posted by
IELTS Writing Task 1: Internet Users in Three Countries (1999-2009)
Posted inIELTS Writing Task 1 Graph with Trends

IELTS Writing Task 1: Internet Users in Three Countries (1999-2009)

The line graph compares the percentage of people in three countries who used theInternet between 1999 and 2009.It…
Posted by
Households with a regular use of a car, Great Britain
Posted inIELTS Writing Task 1

IELTS Writing Task 1: Car Ownership in Great Britain (1971-2007)

The graph shows changes in the number of cars per household in Great Britain over aperiod of 36…
Posted by

Posts pagination

Previous page 1 2 3

Recent Posts

  • University of Aberdeen Medicine Interview Questions
  • University of East London Interview Questions
  • The map below is of the town of Garlsdon. A new supermarket (S) is planned for the town. The map shows two possible sites for the supermarket.
  • The diagrams below show some principles of house design for cool and for warm climates
  • The diagram below shows the process by which bricks are manufactured for the building industry.

Recent Comments

  1. Wealth Management on The map below is of the town of Garlsdon. A new supermarket (S) is planned for the town. The map shows two possible sites for the supermarket.
  2. Forum on The map below is of the town of Garlsdon. A new supermarket (S) is planned for the town. The map shows two possible sites for the supermarket.
  3. Накрутка пф on The map below is of the town of Garlsdon. A new supermarket (S) is planned for the town. The map shows two possible sites for the supermarket.
  4. Investing on The map below is of the town of Garlsdon. A new supermarket (S) is planned for the town. The map shows two possible sites for the supermarket.
  5. Накрутка пф on The map below is of the town of Garlsdon. A new supermarket (S) is planned for the town. The map shows two possible sites for the supermarket.

Archives

  • April 2025
  • March 2025
  • February 2024

Categories

  • Comparative Graph
  • Graph with Trends
  • IELTS Writing Task 1
  • Maps
  • Process Diagram
  • UK University Interview Questions
  • Uncategorized

John Doe

John Doe is a versatile writer with a passion for storytelling. With a background in literature and a love for exploring diverse themes, his words captivate and resonate with readers across genres.

  • Facebook
  • Twitter
  • Instagram
  • LinkedIn
  • YouTube
  • Pinterest

Recent Posts

  • University of Aberdeen Medicine Interview Questions
  • University of East London Interview Questions
  • The map below is of the town of Garlsdon. A new supermarket (S) is planned for the town. The map shows two possible sites for the supermarket.
    The map below is of the town of Garlsdon. A new supermarket (S) is planned for the town. The map shows two possible sites for the supermarket.
  • The diagrams below show some principles of house design for cool and for warm climates
    The diagrams below show some principles of house design for cool and for warm climates

Categories

  • Comparative Graph
  • Graph with Trends
  • IELTS Writing Task 1
  • Maps
  • Process Diagram
  • UK University Interview Questions
  • Uncategorized
Tags

Academic Writing Tips Comparative Graph IELTS Band 9 Model Answer IELTS Task 1 Graph Analysis IELTS Task 1 Line Graph IELTS Vocabulary IELTS Writing Exercises IELTS Writing Exercises Academic Writing Tips IELTS Writing Task 1 Monthly Temperature and Precipitation Process Diagram

Ads
About Listening Writing Module

When an obscure printer gathered a galley and jumbled it to craft a sample book, it lasted not just five decades but five centuries.

  • Facebook
  • Instagram
  • YouTube
Categories
  • Comparative Graph
  • Graph with Trends
  • IELTS Writing Task 1
  • Maps
  • Process Diagram
  • UK University Interview Questions
  • Uncategorized
  • University of Aberdeen Medicine Interview Questions
  • University of East London Interview Questions
  • The map below is of the town of Garlsdon. A new supermarket (S) is planned for the town. The map shows two possible sites for the supermarket.
    The map below is of the town of Garlsdon. A new supermarket (S) is planned for the town. The map shows two possible sites for the supermarket.
Copyright 2025 — listeningwritingmodule.com. All rights reserved.
Design By HLC Solutions
Scroll to Top