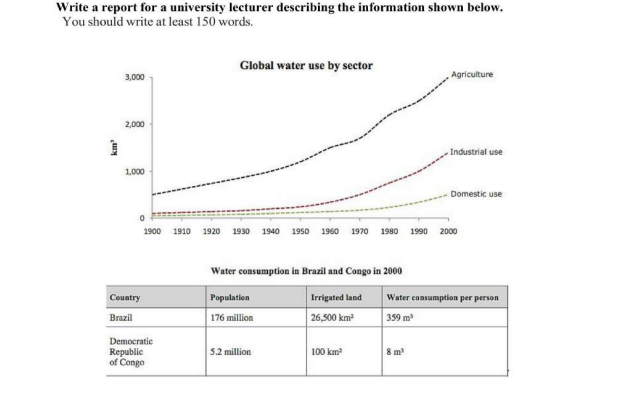
The charts compare the amount of water used for agriculture, industry and homes
around the world, and water use in Brazil and the Democratic Republic of Congo.
It is clear that global water needs rose significantly between 1900 and 2000,
and that agriculture accounted for the largest proportion of water used. We can
also see that water consumption was considerably higher in Brazil than in the
Congo.
In 1900, around 500km³ of water was used by the agriculture sector worldwide.
The figures for industrial and domestic water consumption stood at around one fifth
of that amount. By 2000, global water use for agriculture had increased to around
3000km³, industrial water use had risen to just under half that amount, and
domestic consumption had reached approximately 500km³.
In the year 2000, the populations of Brazil and the Congo were 176 million and 5.2
million respectively. Water consumption per person in Brazil, at 359m³, was much
higher than that in the Congo, at only 8m³, and this could be explained by the fact
that Brazil had 265 times more irrigated land.
184 Words
Band Score Analysis
Estimated IELTS Band Score: 7.5
- Task Achievement: 7.0 – Covers all aspects but could provide a clearer comparison.
- Coherence & Cohesion: 8.0 – Well-structured with logical flow.
- Lexical Resource: 7.5 – Uses a variety of vocabulary but could enhance precision.
- Grammar: 7.5 – Mostly accurate but contains minor errors.
Rewritten Essays
Band 7-8
The provided charts illustrate the worldwide usage of water across three sectors (agriculture, industry, and domestic use) from 1900 to 2000, along with a comparison of water consumption in Brazil and the Democratic Republic of Congo in 2000.
It is evident that global water consumption increased substantially over the century, with agriculture being the dominant sector. In 1900, agricultural water use stood at approximately 500 km³, while industrial and domestic sectors accounted for smaller shares. By 2000, agricultural water consumption had surged to nearly 3,000 km³, while industrial use had risen to about half that amount. Domestic water use also experienced a gradual increase.
The table highlights the significant difference in water consumption between Brazil and the Congo. In 2000, Brazil had a much larger population (176 million) compared to the Congo (5.2 million). Water consumption per person in Brazil was 359 m³, vastly higher than the 8 m³ recorded in the Congo. This can be attributed to the fact that Brazil had a considerably larger irrigated land area (26,500 km² vs. 100 km²).
Overall, the data suggest that global water use has risen dramatically, with agriculture being the largest consumer, and that water consumption per capita is highly dependent on factors such as irrigation and industrial development.
Word Count: 176
Band 9
The provided graph and table illustrate the trends in global water consumption across three key sectors—agriculture, industry, and domestic use—over the 20th century, as well as a comparison of water usage in Brazil and the Democratic Republic of Congo in 2000.
The data reveal a steady increase in global water consumption, with agriculture consistently being the largest consumer. In 1900, agricultural water usage was around 500 km³, while industrial and domestic water use were significantly lower. By 2000, agricultural consumption had risen sharply to nearly 3,000 km³, while industrial use had expanded to just under half that figure. Domestic water usage, although increasing gradually, remained the smallest sector.
The table provides a stark contrast between Brazil and the Congo in terms of water usage. Despite having a vastly larger population (176 million vs. 5.2 million), Brazil’s water consumption per capita was dramatically higher at 359 m³, compared to only 8 m³ in the Congo. A key reason for this discrepancy is the vast difference in irrigated land area, with Brazil possessing 26,500 km² compared to just 100 km² in the Congo.
In summary, global water consumption has risen dramatically, with agriculture remaining the dominant sector. Moreover, the disparity in national water use highlights the influence of irrigation and industrialization on per capita consumption.
Word Count: 182
Comparison Table
| Feature | Band 7-8 Version | Band 9 Version |
|---|---|---|
| Vocabulary | Uses clear but simpler vocabulary (e.g., “much larger population”) | Uses advanced and precise vocabulary (e.g., “vastly larger population”) |
| Sentence Structure | More straightforward sentence construction | More complex sentence structures with varied transitions |
| Data Presentation | Provides clear figures with explanations | Highlights contrasts more effectively |
| Clarity & Cohesion | Well-organized but slightly less refined | More sophisticated and cohesive |
Examples from Essays
| Aspect | Band 7-8 Example | Band 9 Example |
|---|---|---|
| Sentence Structure | “Water consumption per person in Brazil was 359 m³, much higher than in the Congo, at only 8 m³.” | “Despite having a vastly larger population, Brazil’s per capita water consumption was dramatically higher at 359 m³, compared to only 8 m³ in the Congo.” |
| Data Presentation | “By 2000, agricultural consumption had risen to nearly 3,000 km³, while industrial use had increased to about half that amount.” | “By 2000, agricultural water consumption had surged to nearly 3,000 km³, while industrial use had expanded to just under half that figure.” |
| Clarity & Cohesion | “This can be attributed to the fact that Brazil had a considerably larger irrigated land area.” | “A key reason for this discrepancy is the vast difference in irrigated land area.” |
Grammar Mistakes
- Original: “We can also see that water consumption was considerably higher in Brazil than in the Congo.”
Correction: “It is also evident that Brazil’s water consumption was significantly higher than that of the Congo.” - Original: “The figures for industrial and domestic water consumption stood at around one fifth of that amount.”
Correction: “Industrial and domestic water consumption accounted for approximately one-fifth of that figure.” - Original: “This can be explained by the fact that Brazil had 265 times more irrigated land.”
Correction: “This disparity can be attributed to Brazil having 265 times more irrigated land.”
Vocabulary Repetition
| Repeated Word | Suggested Alternatives |
|---|---|
| “Consumption” | Usage, Utilization, Expenditure |
| “Higher” | Greater, Elevated, Significantly More |
| “Increase” | Growth, Surge, Expansion |
IELTS Writing Task 1 Exercises with Answers
Fill in the blanks using appropriate words:
- The graph illustrates the changes in global water _______ (consumption/expansion) across three key sectors.
Answer: consumption - By 2000, agricultural water use had _______ (risen/fallen) sharply to nearly 3,000 km³.
Answer: risen - The table highlights a stark _______ (contrast/similarity) between Brazil and the Congo in terms of water usage.
Answer: contrast - Brazil’s significantly larger _______ (irrigated land/desert area) contributes to its high water consumption.
Answer: irrigated land

