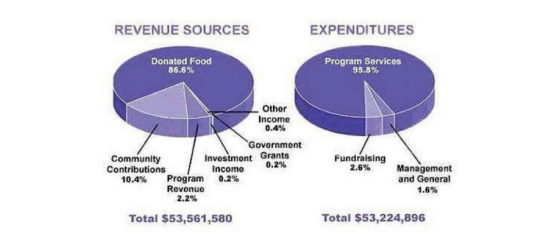
The pie charts show the amount of revenue and expenditures over a year of a children’s
charity in the USA. Overall, it can be seen that donated food accounted for the majority of
the income, while program services accounted for the most expenditure. Total revenue
sources just exceeded outgoings.
In detail, donated food provided most of the revenue for the charity, at 86%. Similarly,
with regard to expenditures, one category, program services, accounted for nearly all of
the outgoings, at 95.8%.
The other categories were much smaller. Community contributions, which were the second
largest revenue source, brought in 10.4% of overall income, and this was followed by
program revenue, at 2.2%. Investment income, government grants, and other income were
very small sources of revenue, accounting for only 0.8% combined.
There were only two other expenditure items, fundraising and management and general,
accounting for 2.6% and 1.6% respectively. The total amount of income was
$53,561,580, which was just enough to cover the expenditures of
$53,224,896.
Words 164
Estimated IELTS Band Score: 7.5 – 8.0
- Task Achievement (7.5):
Clearly describes the major sources of revenue and primary expenditures, with relevant comparisons. Could add minor details for completeness. - Coherence & Cohesion (8.0):
Logical structure with clear topic sentences and smooth transitions. - Lexical Resource (7.5):
Uses a good range of vocabulary; minor room for more synonyms. - Grammar & Accuracy (7.5):
Mostly accurate, with some potential for more varied complex structures.
Band 8
The two pie charts illustrate the total revenue and expenditures of a children’s charity in the USA over a one-year period. Overall, donated food made up the vast majority of the charity’s income, while program services accounted for nearly all of the spending.
Looking at revenue, the organization received $53,561,580 in total. Donated food was by far the largest contributor at 86.6%. The second-highest source was community contributions at 10.4%, followed by program revenue at 2.2%. Other sources, including investment income, government grants, and other income, collectively made up less than 1%.
Regarding expenditures, the charity spent $53,224,896. Of this, 95.8% went to program services, leaving just 4.2% for other expenses. Specifically, fundraising took 2.6%, while management and general costs were 1.6%. Overall, the charity’s total revenue slightly exceeded its total outgoings, indicating a nearly balanced budget.
Word Count: 150
Band 9
The pie charts compare how a children’s charity in the USA generated and spent funds over the course of a year. Notably, donated food constituted the overwhelming majority of the organization’s income, whereas program services represented almost all of its expenditures.
In terms of revenue, the charity took in $53,561,580. Donated food dominated at 86.6%, followed by community contributions at 10.4%. Program revenue accounted for 2.2%, and the remaining sources—investment income, government grants, and other income—collectively formed a marginal 0.8%.
Expenditures amounted to $53,224,896, with 95.8% directed toward program services. The remaining outlays included fundraising (2.6%) and management and general expenses (1.6%). These proportions indicate that nearly all spending was allocated to the charity’s primary mission, while overhead costs were kept relatively low. Interestingly, total revenue slightly surpassed total spending, suggesting the organization operated on a tight but positive budget.
Word Count: 163
Comparison Table
| Aspect | Band 7-8 Version | Band 9 Version |
|---|---|---|
| Vocabulary | Clear and direct (“vast majority,” “accounted for”) | More precise/academic (“overwhelming majority,” “dominated,” “allocated”) |
| Sentence Structure | Mostly straightforward with some complex sentences | More varied, including subordinate clauses and smooth transitions |
| Data Presentation | Covers main data effectively, mentions key percentages and totals | Emphasizes major contrasts, highlights specific figures, offers additional insight |
| Clarity & Cohesion | Well-structured, logical flow | Slightly more refined transitions, concluding statements more succinct |
Examples from Essays
| Aspect | Band 7-8 Example | Band 9 Example |
|---|---|---|
| Sentence Structure | “Of this, 95.8% went to program services, leaving just 4.2% for other expenses.” | “Expenditures amounted to $53,224,896, with 95.8% directed toward program services.” |
| Data Presentation | “The second-highest source was community contributions at 10.4%.” | “Donated food dominated at 86.6%, followed by community contributions at 10.4%.” |
| Clarity & Cohesion | “Overall, the charity’s total revenue slightly exceeded its total outgoings.” | “Interestingly, total revenue slightly surpassed total spending, suggesting a tight but positive budget.” |
Grammar Mistakes
- Original: “Donated food accounted for the majority of the revenue, with 86.6%. While Program services accounted for 95.8% of expenditures.”
Correction: “Donated food accounted for 86.6% of the revenue, while program services made up 95.8% of expenditures.” (Combine sentences for smoother flow, fix capitalization.) - Original: “The second largest source was community contributions, at 10.4%.”
Correction: “The second-largest source was community contributions, at 10.4%.” (Hyphen needed for compound adjective.) - Original: “Overall, the revenue total was $53,561,580 and the expenditures were $53,224,896, so the difference was just a small margin.”
Correction: “Overall, total revenue was $53,561,580, while expenditures stood at $53,224,896, leaving only a small margin between them.” (Improved clarity and variety.)
Vocabulary Repetition
| Repeated Word | Suggested Alternatives |
|---|---|
| “Majority” | Overwhelming share, Dominant portion |
| “Spending” | Expenditures, Outlays, Disbursements |
| “Revenue” | Income, Funds, Incoming resources |
IELTS Writing Task 1 Exercises with Answers
Fill in the blanks using the words below:
(dominates, allocation, marginal, comprises, expenditures, contributed, overhead)
- The pie charts show the annual revenue and _______ of a children’s charity in the USA.
Answer: expenditures - Donated food _______ 86.6% of total revenue, while community contributions made up 10.4%.
Answer: comprises - Fundraising and management, considered _______ costs, together accounted for only 4.2% of spending.
Answer: overhead - Program services _______ the largest share of outgoings, at 95.8%.
Answer: dominates - Community contributions _______ 10.4% of overall income, ranking second among revenue sources.
Answer: contributed - The difference between revenue and spending was _______, indicating a tight but positive budget _______.
Answer: marginal, allocation